 喻徳忠,刘小方,刘潇,周妍,曹文成,张晓甜,闻胜.湖北省部分地区牛奶中多氯联苯的污染水平和暴露分析[J].中国食品卫生杂志,2018,30(2):172-176.
 DOi:10.13590/j.cjfh.2018.02.010
湖北省部分地区牛奶中多氯联苯的污染水平和暴露分析
(1.武汉工程大学,湖北 武汉430205; 2.湖北省疾病预防控制中心 应用毒理湖北省 重点实验室,湖北 武汉430072)
收稿日期:2018-02-23
作者简介:喻徳忠男副教授研究方向为环境工程E-mail:yudezhongwh@163.com 通信作者:闻胜男副研究员研究方向为环境和食品中持久性有机污染物分布及其对人体健康的危害E-mail:wenshenggy@qq.com
基金项目:国家重点研发计划(2017YFC1600500);湖北省卫生和计划生育委员会疾控及医药院校科研专项(WJ2016J-023)
摘要:目的调查湖北省部分地区牛奶样品中6种指示性多氯联苯(polychlorinated biphenyls,PCBs)的含量水平。方法2014年在湖北省部分地区共采集了30份本地产牛奶样品,利用同位素稀释-高分辨气相-高分辨磁质谱(HRGC-HRMS)法测定牛奶样品中6种指示性PCBs浓度水平和指纹特征。同时计算湖北省居民单位体重通过牛奶的指示性PCBs的日摄入量,并与国内外研究比较,评估其暴露风险。 结果牛奶样品中指示性PCBs总含量为107.2~4 311.2 pg/g fat,平均值为699.9 pg/g fat,中位数为433.9 pg/g fat。牛奶样品中贡献率最高的化合物为PCB-28,其次是PCB-153和PCB-138。湖北省居民单位体重通过牛奶的指示性PCBs的日摄入量的平均值和高端暴露值(以P95计)分别为0.001 47和0.005 25 ng/kg BW。结论湖北省牛奶中指示性PCBs含量处于较低水平,居民通过牛奶摄入指示性PCBs的健康风险较低。
关键词:
多氯联苯; 牛奶; 高分辨气相-高分辨磁质谱; 食品污染物; 膳食暴露; 分析
文章编号:1004-8456(2018)02-0172-05
中图分类号:R155
文献标志码:A
The study on pollution levels and exposure of polychlorinated biphenyls in milk in some areas of Hubei Province
(1.Wuhan Institute of Technology, Hubei Wuhan 430205, China; 2.Hubei Provincial Key Laboratory for Applied Toxicology, Hubei Provincial Center for Disease Control and Prevention,Hubei Wuhan 430072, China)
Abstract:ObjectiveTo investigate the levels of six indicator polychlorinated biphenyls (PCBs) in milk samples from some areas of Hubei Province. MethodsThirty locally milk samples were collected in 2014 from some areas of Hubei Province. Concentrations of six indicator PCBs in milk samples were measured by isotope dilution-high resolution gas chromatography-high resolution mass spectrometry (HRGC-HRMS). The daily intake of residents in Hubei Province through milk was calculated and compared with domestic and foreign studies, and the exposure risk was assessed. Results
The content of indicator PCBs in milk was 107.2-4 311.2 pg/g fat, the mean and median value was 699.9 and 433.9 pg/g fat, respectively. The compounds with the highest contribution rate in milk samples were PCB-28, followed by PCB-153 and PCB-138. The average and high level (P95) daily intake of residents in Hubei Province through milk is 0.001 47 and 0.005 25 ng/kg BW, respectively. ConclusionThe concentrations of indicator PCBs in milk of Hubei were at low level and residents in this province had low health risks through milk intake.
Key words:
Polychlorinated biphenyls; milk; high resolution gas chromatography-high resolution mass spectrometry; food contaminants; dietary exposure; analysis
多氯联苯(polychlorinated biphenyls,PCBs)是一类合成化合物,PCBs包含209种化合物,被分为二噁英类多氯联苯(dioxin-like PCBs,DL-PCBs)和非二噁英类多氯联苯(non-dioxin-like PCBs,NDL-PCBs),由于其具有良好的化学稳定性、低导热性和高介电常数,PCBs被全世界广泛生产应用。从1929年开始,全世界生产PCBs已经超过了15万吨[1]。尽管在20世纪70年代PCBs逐渐被全世界各国停止使用,但也一直被应用于密封性仪器,比如电容器和变压器,但是这种使用会随着时间的推移而减少[2-4]。废物处理,包括家庭和工业废物,是造成PCBs环境污染的主要来源。
PCBs会导致癌症的发展,免疫功能紊乱,生殖、神经或其他生物系统故障[5-6]。通过对各类介质的测定,各国际机构确定了6种(PCB-28,PCB-52,PCB-101,PCB-138,PCB-153和PCB-180)容易被量化且能够代表该类化合物的NDL-PCBs,被称为指示性PCBs(indicator PCBs)[7]。我国标准GB 5009.190—2014《食品安全国家标准 食品中指示性多氯联苯含量的测定》[8]规定了食品中指示性多氯联苯为7种(PCB-28,PCB-52,PCB-101,PCB-118,PCB-138,PCB-153和PCB-180)。为了便于与国内外文献数据比较,本研究以6种NDL-PCBs作为研究对象。鉴于PCBs对人体健康的威胁,欧盟对食品中6种指示性PCBs的总含量规定了最大限量[9]。我国标准GB 2762—2017《食品安全国家标准 食品中污染物限量》[10]也规定了水产动物及其制品中7种指示性PCBs的限值。为保证食品安全,有必要对食品中指示性PCBs的本底水平进行相应的调查。本研究采用6种指示性PCBs代表PCBs的污染水平。
 其中:E为6种指示性PCBs每日膳食摄入量(ng/kg BW),C为牛奶中指示性PCBs含量(pg/g),F为牛奶消费量(g/d),BW为体重(kg,标准人体重按63 kg计)[12-13]。本研究采用标准人(定义为从事轻体力的劳动的成年男性,体重以63 kg计)计算指示性PCBs的膳食摄入水平,用于评价中国一般人群的指示性PCBs膳食摄入的情况以及健康风险评估。虽然目前各国尚未制定PCBs总量的每日允许摄入值,但是美国疾病预防控制中心有毒物质与疾病登记处(Agency for Toxic Substances and Disease Registry,ATSDR)提出了经口摄入PCBs日均允许摄入量为20 ng/kg BW[14]。本研究将计算的PCBs每日膳食暴露量与其比较,评估湖北省居民通过牛 奶的日摄入量指示性PCBs的风险。
将不同地区牛奶样品中6种指示性PCBs含量的平均值进行比较,结果见图2。发现孝感市牛奶样品中以PCB-153和PCB-138为主要贡献化合物。查询相关文献[15-17],发现孝感市与意大利部分地区牛奶中6种指示性PCBs的污染构成类似。除孝感市外,其他8个地市牛奶样品中指示性PCBs的污染构成相似,以PCB-28为最高贡献化合物,其次为PCB-153和PCB-138。目前,我国对牛奶中指示性PCBs的污染构成尚未有相关报道,但本研究与洞庭湖水域鱼类[18]、深圳市市售食品[19]、2007年中国总膳食研究[20]和2010年湖北总膳食研究[21]中指示性PCBs的构成相似,说明我国大部分地区指示性PCBs的污染来源较为相似。
湖北省本地产牛奶中6种指示性PCBs含量的平均值、P95和最大值分别为0.015 7、0.056 1和0.084 3 ng/g(以湿重计),根据膳食摄入量的公式计算出湖北省居民指示性PCBs牛奶摄入量的平均值和高端暴露值(以P95计)分别为0.001 47和0.005 25 ng/kg BW。将其分别与国外相关文献数据比较发现,比利时居民的牛奶中指示性PCBs膳食摄入量为0.1 ng/kg BW[13],约为本研究的68和19倍。意大利为0.78 ng/kg BW[22],约为本研究的531和149倍。与美国疾病预防控制中心有毒物质与疾病登记处[14]提出的经口摄入PCBs的每日允许摄入值(20 ng/kg BW)比较,本研究的高端暴露摄入量(0.005 25 ng/kg BW)仅占其0.026%。第五次中国总膳食研究关于乳类中指示性PCBs的膳食摄入量为(0.01±0.01)ng/kg BW[12],与本研究相近。另外,荷兰国家公共卫生与环境研究所给出了食品中6种指示性PCBs的膳食摄入量为5.6 ng/kg BW[25]。欧洲食品安全局也给出了食品中指示性PCBs的膳食摄入量,范围为4.3~25.7 ng/kg BW[27]。
结果表明,本研究中湖北省居民对牛奶中指示性PCBs的膳食摄入量平均水平远低于其他发达国家。同时,湖北省居民对牛奶中指示性PCBs的膳食摄入量的高端暴露水平也普遍低于其他发达国家以及食品中指示性PCBs的膳食摄入量。这可能由于我国PCBs的使用年限较短,中国PCBs原料从1965年开始生产,于1974年被禁止使用,在此期间生产的PCBs总量大约只有1万吨左右,仅占全球PCBs使用量的0.77%[28-29]。另外也与我国居民牛奶摄入量,以及牛奶可能不是中国居民膳食PCBs主要摄入来源有关。
PCBs会导致癌症的发展,免疫功能紊乱,生殖、神经或其他生物系统故障[5-6]。通过对各类介质的测定,各国际机构确定了6种(PCB-28,PCB-52,PCB-101,PCB-138,PCB-153和PCB-180)容易被量化且能够代表该类化合物的NDL-PCBs,被称为指示性PCBs(indicator PCBs)[7]。我国标准GB 5009.190—2014《食品安全国家标准 食品中指示性多氯联苯含量的测定》[8]规定了食品中指示性多氯联苯为7种(PCB-28,PCB-52,PCB-101,PCB-118,PCB-138,PCB-153和PCB-180)。为了便于与国内外文献数据比较,本研究以6种NDL-PCBs作为研究对象。鉴于PCBs对人体健康的威胁,欧盟对食品中6种指示性PCBs的总含量规定了最大限量[9]。我国标准GB 2762—2017《食品安全国家标准 食品中污染物限量》[10]也规定了水产动物及其制品中7种指示性PCBs的限值。为保证食品安全,有必要对食品中指示性PCBs的本底水平进行相应的调查。本研究采用6种指示性PCBs代表PCBs的污染水平。
1材料与方法
1.1材料
1.1.1样品采样
按照国家食品安全风险监测的样品采集要求,在湖北省武汉、襄阳、宜昌、荆州等9个地市共采集了30份牛奶样品,样品采集后放入装有冰袋的运输箱运送到实验室,置于-20 ℃保存,待检。
1.1.2主要仪器与试剂
高分辨气相色谱-高分辨磁质谱仪(DFS,美国ThermoFisher),加速溶剂萃取仪(E-914)、旋转蒸发仪(R-210)均购自瑞士BCHI,全自动样品净化系统(JF602,北京普立泰科仪器有限公司),混合硅胶柱、氧化铝柱、碳柱均购自美国FMS,冷冻干燥机。PCBs标准系列曲线(WM48-CVS)、13C标记的PCBs定量内标标准溶液(P48-M-ES)、回收率内标标准溶液(P48-RS)、质控样品(WMF-01)均购自加拿大Wellington,正己烷、二氯甲烷均为农残级。
1.2方法
1.2.1样品处理
样品的处理方法参考GB 5009.190—2014中第一法[8]。为了提高仪器分析的准确性和灵敏度,本研究采用高分辨磁质谱仪替代国标方法中的低分辨质谱仪进行样品的检测分析,仪器分析方法参考 GB 5009 205—2013《食品安全国家标准 食品中二噁英及其类似物毒性当量的测定》[11]。
1.2.2质量控制
严格按照GB 5009.190—2014[8]的要求进行质量控制,每批次8份样品带1个空白试验和1份质控样品(WMF-01)。PCBs定量内标的回收率在35%~70%之间,检出限范围为0.030~0.10 pg/g fat。本实验室为国家食品安全风险监测二噁英参比实验室,自2010年以来连续七年参加了挪威公共卫生研究所和联合国环境卫生署组织的包括食品中指示性PCBs在内的多种持久性有机污染物分析能力的国际比对,指示性PCBs的Z值为0.001 1~0.91,结果均为合格。
1.2.3膳食摄入量
根据测得的牛奶样品中指示性PCBs的含量(以湿重计算),结合第五次中国总膳食中牛奶(乳类)样品的膳食消费量数据,计算牛奶中指示性PCBs的每日膳食摄入量。计算公式为: 其中:E为6种指示性PCBs每日膳食摄入量(ng/kg BW),C为牛奶中指示性PCBs含量(pg/g),F为牛奶消费量(g/d),BW为体重(kg,标准人体重按63 kg计)[12-13]。本研究采用标准人(定义为从事轻体力的劳动的成年男性,体重以63 kg计)计算指示性PCBs的膳食摄入水平,用于评价中国一般人群的指示性PCBs膳食摄入的情况以及健康风险评估。虽然目前各国尚未制定PCBs总量的每日允许摄入值,但是美国疾病预防控制中心有毒物质与疾病登记处(Agency for Toxic Substances and Disease Registry,ATSDR)提出了经口摄入PCBs日均允许摄入量为20 ng/kg BW[14]。本研究将计算的PCBs每日膳食暴露量与其比较,评估湖北省居民通过牛 奶的日摄入量指示性PCBs的风险。
2结果与分析
2.1牛奶样品中指示性PCBs的含量水平
本次调查湖北省部分地区牛奶样品中指示性PCBs的含量结果见表1,结果以脂肪重量计。其中PCB-28,PCB-52,PCB-101,PCB-138,PCB-180在30份牛奶样品中均有检出。6种指示性PCBs总含量范围为107.2~4 311.2 pg/g fat,平均值为699.9 pg/g fat,中位数为433.9 pg/g fat,第95百分位数(P95)为3 017.4 pg/g fat。牛奶中平均含量最高的化合物为PCB-28,对总贡献率的均值为34.6%;其次为PCB-153和PCB-138,对总贡献率的均值分别为22.1%和19.6%。|
|
表1湖北地区牛奶样品中指示性PCBs含量(n=30) Table 1Indicator PCBs in milk samplescollected from Hubei Province 注:a为贡献率由样品平均值计算 |
2.2湖北省不同地区牛奶样品中指示性PCBs的含量水平对比
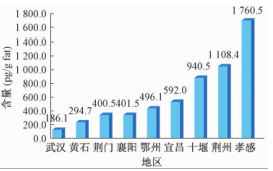
将不同地区牛奶样品中6种指示性PCBs的总含量平均值进行比较,结果见图1。可以看出,不同地区牛奶样品中PCBs的污染程度不一,其中孝感、荆州和十堰地区的污染水平相对较高,其他地区指示性PCBs的污染水平范围为186.1~592.0 pg/g fat。
|
注:所有数据为平均值(n≥3) 图1湖北地区不同城市的牛奶样品中6种指示性PCBs的含量 Figure 1Levels of 6 indicator PCBs in milk samples from different areas in Hubei Province |

|
注:所有数据均为平均值 图2湖北地区牛奶样品中6种指示性PCBs平均含量 Figure 2Concentrationof 6 indicator PCBs in milk samples from different areas in Hubei Province |
2.3与国内外研究的对比
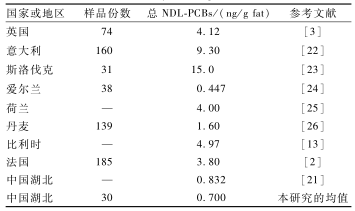
把本研究与不同国家或地区的牛奶样品中6种指示性PCBs的含量进行比较,结果见表2。相关数据显示,发达国家牛奶样品中指示性PCBs的含量普遍高于本研究的水平,其中斯洛伐克(15.0 ng/g fat)、意大利(9.30 ng/g fat)、丹麦(1.60 ng/g fat)分别是本研究的21、13、2倍。2010年欧盟监测报告中也给出了牛奶中6种指示性PCBs的含量范围为9.14~22.1 ng/g fat,远高于本研究的水平。中等发达国家的指示性PCBs含量水平如爱尔兰(0.447 ng/g fat),和中国湖北(0.832 ng/g fat)与本研究相近。
|
表2不同国家或地区牛奶中6种指示性PCBs含量比较 Table 2Comparison of 6 indicative PCBs in milk of different country and region 注:—表示无样品数 |
2.4湖北省居民对牛奶中指示性PCBs的膳食摄入分析
食品中指示性PCBs的暴露,缺少国际认可的每日允许摄入限值(TDI)。截至到目前为止,只有少数研究评估了居民对牛奶中指示性PCBs的膳食摄入量[13,22]。本研究中,将湖北省居民的PCBs每日膳食摄入量与其比较,评估湖北省居民通过牛奶摄入指示性PCBs的风险。湖北省本地产牛奶中6种指示性PCBs含量的平均值、P95和最大值分别为0.015 7、0.056 1和0.084 3 ng/g(以湿重计),根据膳食摄入量的公式计算出湖北省居民指示性PCBs牛奶摄入量的平均值和高端暴露值(以P95计)分别为0.001 47和0.005 25 ng/kg BW。将其分别与国外相关文献数据比较发现,比利时居民的牛奶中指示性PCBs膳食摄入量为0.1 ng/kg BW[13],约为本研究的68和19倍。意大利为0.78 ng/kg BW[22],约为本研究的531和149倍。与美国疾病预防控制中心有毒物质与疾病登记处[14]提出的经口摄入PCBs的每日允许摄入值(20 ng/kg BW)比较,本研究的高端暴露摄入量(0.005 25 ng/kg BW)仅占其0.026%。第五次中国总膳食研究关于乳类中指示性PCBs的膳食摄入量为(0.01±0.01)ng/kg BW[12],与本研究相近。另外,荷兰国家公共卫生与环境研究所给出了食品中6种指示性PCBs的膳食摄入量为5.6 ng/kg BW[25]。欧洲食品安全局也给出了食品中指示性PCBs的膳食摄入量,范围为4.3~25.7 ng/kg BW[27]。
结果表明,本研究中湖北省居民对牛奶中指示性PCBs的膳食摄入量平均水平远低于其他发达国家。同时,湖北省居民对牛奶中指示性PCBs的膳食摄入量的高端暴露水平也普遍低于其他发达国家以及食品中指示性PCBs的膳食摄入量。这可能由于我国PCBs的使用年限较短,中国PCBs原料从1965年开始生产,于1974年被禁止使用,在此期间生产的PCBs总量大约只有1万吨左右,仅占全球PCBs使用量的0.77%[28-29]。另外也与我国居民牛奶摄入量,以及牛奶可能不是中国居民膳食PCBs主要摄入来源有关。
3小结
本研究通过对湖北省部分地区牛奶样品中6种指示性PCBs污染情况进行分析,通过与国内外文献数据对比发现,湖北省部分地区牛奶样品中的指示性PCBs的含量和膳食摄入量均较低。PCB-28、PCB-138、PCB-153为湖北省部分地区牛奶样品中指示性PCBs的主要成分,这与我国大部分地区的指示性PCBs污染特征类似。比较膳食结构中牛奶的摄入量,显示湖北省居民通过牛奶摄入指示性PCBs的健康风险较低。
参考文献
[1]ELNAR A A, DIESEL B, DESOR F, et al. Neurodevelopmental and behavioral toxicity via lactational exposure to the sum of six indicator non-dioxin-like-polychlorinated biphenyls (∑6 NDL-PCBs) in mice[J]. Toxicology, 2012, 299(1):44-54.
[2]ARNICH N, TARD A, LEBLANC J C, et al. Dietary intake of non-dioxin-like PCBs (NDL-PCBs) in France, impact of maximum levels in some foodstuffs[J]. Regulatory Toxicology and Pharmacology,2009, 54(3):287-293.
[3]LAKE I R,FOXALL C D,FERNANDES A, et al. The effects of flooding on dioxin and PCB levels in food produced on industrial river catchments[J]. Environment International,2015, 77(1):106-115.
[4]Agency for Toxic Substances and Disease Registry (ATSDR). Toxicological profile for polychlorinated biphenyls (PCBs) [R]. U.S. Department of Health and Human Services, Public Health Service, Atlanta, GA, 2000.
[5]KOGEVINAS M. Human health effects of dioxins: cancer, reproductive and endocrine system effects[J]. Hum Reprod Update,2001, 7(3):331-339
[6]CARPENTER D O. Exposure to and health effects of volatile PCBs[J]. Reviews on Environmental Health, 2015, 30(2):81-92.
[7]EFS Authority. Results of the monitoring of non dioxin-like PCBs in food and feed[J]. EFSA Journal, 2010, 8(3):1385.
[8]中华人民共和国国家卫生和计划生育委员会. 食品安全国家标准 食品中指示性多氯联苯含量的测定:GB 5009.190—2014 [S].北京:中国标准出版社, 2014.
[9]Commission E. Commission Regulation (EU) No 1259/2011 of 2 December 2011 amending Regulation (EC) No 1881/2006 as regards maximum levels for dioxins, dioxin-like PCBs and non dioxin-like PCBs in foodstuffs[J]. Official Journal of the European Union, 2011, 50:18-23.
[10]中华人民共和国国家卫生和计划生育委员会,国家食品药品监督管理总局.食品安全国家标准 食品中污染物限量:GB 2762—2017[S]. 北京:中国标准出版社, 2017.
[11]中华人民共和国国家卫生和计划生育委员会. 食品安全国家标准 食品中二噁英及其类似物毒性当量的测定: GB 5009 205—2013[S].北京:中国标准出版社,2013.
[12]邵懿, 尹帅星, 张磊, 等. 中国居民指示性多氯联苯膳食摄入水平研究[J]. 中华预防医学杂志,2016, 50(6):503-507.
[13]CIMENCI O, VANDEVIJVERE S,GOSCINNY S, et al. Dietary exposure of the Belgian adult population to non-dioxin-like PCBs[J]. Food and Chemical Toxicology,2013, 59(6):670-679.
[14]U.S. Department of Health and Human Services, Agency for Toxic Substances and Disease Registry. Toxicological profile for polychlorinated biphenyls (Update)[EB/OL]. Atsdr Toxicological Profile, 2000[2017-11-10]. http://www.atsdr.cdc.gov/ToxProfiles/tp17.pdf.
[15]BERTOCCHI L, GHIDINI S, FEDRIZZI G, et al. Case-study and risk management of dioxins and PCBs bovine milk contaminations in a high industrialized area in Northern Italy[J]. Environ Sci Pollut Res Int, 2015, 22(13):9775-9785.
[16]STORELLI M M, SCARANO C, SPANU C, et al. Levels and congener profiles of polychlorinated dibenzo-p-dioxins (PCDDs), polychlorinated dibenzofurans (PCDFs) and polychlorinated biphenyls (PCBs) in sheep milk from an industrialised area of Sardinia, Italy[J]. Food & Chemical Toxicology An International Journal Published for the British Industrial Biological Research Association, 2012, 50(5):1413-1417.
[17]INGELIDO A M, ABBALLE A, DI DOMENICO A, et al. Levels and profiles of polychlorinated dibenzo-p-dioxins, polychlorinateddibenzofurans, and polychlorinated biphenyls in feedstuffs and milk from farms in the vicinity of incineration plants in Tuscany, Italy[J]. Archives of Environmental Contamination and Toxicology, 2009,57(2): 397-404.
[18]胡余明. 洞庭湖鱼组织中持久性有机污染物的分析评估研究[D]. 长沙:湖南师范大学,2013: 129.
[19]张建清, 蒋友胜, 周健,等. 深圳市市售食品中二恶英、多氯联苯污染现状研究[J]. 华南预防医学, 2009, 35(6):4-8.
[20]ZHANG L, LI J, ZHAO Y, et al. Polybrominated diphenyl ethers (PBDEs) and indicator polychlorinated biphenyls (PCBs) in foods from China: levels, dietary intake, and risk assessment.[J]. Journal of Agricultural & Food Chemistry, 2013, 61(26):6544-6551.
[21]张瑞, 刘潇, 闻胜, 等. 湖北省9类总膳食样品中指示性多氯联苯的浓度水平和暴露评估[J]. 中国卫生检验杂志, 2015, 25(16):2772-2776.
[22]LORENZI V, GHIDINI S, ANGELONE B, et al. Three years of monitoring of PCDD/F, DL-PCB and NDL-PCB residues in bovine milk from Lombardy and Emilia Romagna regions (Italy): contamination levels and human exposure assessment[J]. Food Control, 2016, 68(3):45-54.
[23]KAMIL Cˇ, FABIIKOV A, CHOVANCOV J, et al. Polychlorinated dibenzo-p-dioxins, dibenzofurans and biphenyls in food samples from areas with potential sources of contamination in Slovakia[J]. Journal of Food & Nutrition Research, 2015, 54(1):50-61.
[24]Dioxin Levels in the Irish Environment: Tenth Assessment (summer 2012).Based on Levels in cows milk[M]. Environmental Protection Agency (Wexford-Ireland), ISBN 978-1-84095-528-6. ISBN.
[25]BAARS A J, BAKKER M I, BAUMANN R A,et al. Dioxins, dioxin-like PCBs and non-dioxin-like PCBs in foodstuffs: occurrence and dietary intake in the Netherlands[J]. Toxicol Lett, 2004, 151(1):51-61.
[26]CEDERBERG T, SORENSEN S, LUND K, et al. Danish monitoring of dioxins and PCB in food and feed during the years 2000 to 2009-levels, time trend and human exposure[J]. DTU Orbit,2010.
[27]European Food Safety Authority. Update of the monitoring of levels of dioxins and PCBs in food and feed[J]. EFSA Journal, 2012, 10(7):2832.
[28]张志, 田崇国, 贾宏亮, 等. 中国多氯联苯(PCBs)网格化的使用清单研究[J]. 黑龙江大学自然科学学报, 2010, 27(1):111-116.
[29]BREIVIK K, SWEETMAN A, PACYNA J M, et al. Towards a global historical emission inventory for selected PCB congeners—a mass balance approach: 3. an update[J]. Science of the Total Environment, 2007, 377(2/3):296-307.